By default, grid lines are enabled when working with Cartesian, plotted, and radar charts. Click the Grid Lines button to disable them, or open the Grid Lines menu to show, hide, or edit grid lines for the x or y axis, or both.
Line Position - Separator: adds X-Axis grid lines between the columns, or groups of columns, to separate each hierarchy.
Line Position - Middle: adds X-Axis grid lines in the middle of each column or group of columns (as in the screenshot)
Minor Grid Lines: use this option to add additional grid lines between the main grid lines.

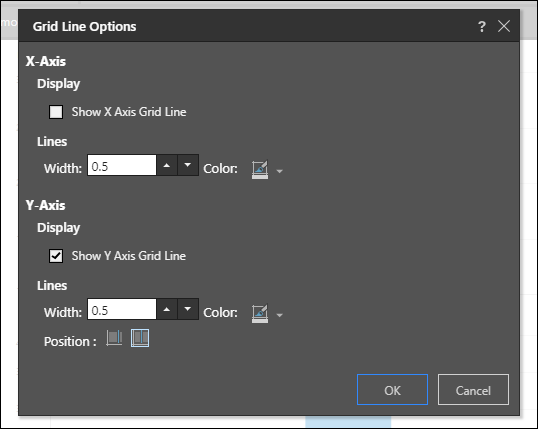
Grid Line Options Dialog
Click More to open the Grid Line Options dialog, where you can:
- show or hide grid lines for each axis
- specify the width and color of grid lines for each axis
- change the position of grid lines on the x-axis